![]()
Frontline Learning Research Vol.13 No. 4 (2025)
68 - 102
ISSN 2295-3159
1Maastricht University, the
Netherlands
Article received 12 June 2024 / revised 25 September 2025 / accepted 17 November 2025 / available online 19 June 2026
This pilot study investigates the relationship between self-regulated learning (SRL) strategies and early dropout in a largely underexplored professional online learning context. Forty-two professionals (N = 42) enrolled in a four-week course delivered via a workplace Learning Experience Platform (LXP) supporting self-directed, adaptive learning pathways. SRL was measured using self-reports and behavioural trace data collected during the first week. A dual-method analytic approach was employed: top-down models (logistic regression and decision trees) tested predefined SRL predictors, while bottom-up methods (hierarchical clustering and process mining) uncovered emergent learner profiles without prior assumptions. Trace-based SRL indicators, particularly the number of unique actions on the platform, time spent during week one, participation in the forum, and completion of an action plan, were significantly stronger predictors of dropout (p < .05) than self-reports, where only the goal-setting subscale was significant. Despite the small sample size limiting generalisability, the study demonstrates that early behavioural engagement patterns can reliably predict learner persistence, often outperforming self-reported SRL measures. These findings advance our understanding of SRL in professional online learning environments and provide a replicable analytic framework for integrating trace data and surveys. By identifying actionable SRL behaviours linked to course completion, this study contributes toward the development of adaptive workplace learning systems capable of detecting and mitigating early disengagement in real time.
Keywords: Self-Regulated Learning, Dropout, Trace Data, Online Learning, Professional Development
According to industry reports, 90% of organisations in the United States conduct at least some of their mandatory training online, and 46% offer training exclusively online (Training Magazine, 2023). Yet despite the expansion of the online learning industry (IMARC Group, 2023), dropout continues to undermine its effectiveness. High dropout rates in online learning contexts remain a persistent concern (Kizilcec & Halawa, 2015; Wong et al., 2021), with studies reporting completion rates as low as 0.7%, implying dropout rates above 90% in some courses (Jordan, 2015; Kizilcec & Halawa, 2015; Wong et al., 2021). For professional learners, who often juggle full-time jobs, family responsibilities, and limited time for self-directed study, sustaining participation in online courses can pose significant difficulties (Hew & Cheung, 2014; Milligan & Littlejohn, 2014).
Given these challenges, there is increasing interest in identifying which factors predict learner persistence and dropout in online professional learning environments. In these settings, direct and immediate instructor support is often limited, and learners are expected to create, monitor, and adjust their own learning behaviours to meet performance goals (Dabbagh & Kitsantas, 2004; Kizilcec et al., 2017; Roll & Winne, 2015). Self-regulated learning (SRL) strategies support these demands by helping learners set goals, plan their study, monitor progress, manage time, seek help, and adapt their approach in response to difficulties (Broadbent & Poon, 2015; Kizilcec et al., 2017). SRL has been defined as “an active, constructive process of goal setting and attempting to monitor, regulate, and control cognition, motivation, and behaviour, guided and constrained by goals and the contextual features in the environment” (Van Halem et al., 2020). In flexible corporate e-learning environments, where learners have little external structure, self-regulation becomes key to staying engaged and avoiding early dropout (Frankola, 2001; Margaryan, Littlejohn, & Milligan, 2013; Milligan & Littlejohn, 2014).
While SRL has been extensively studied in academic and higher-education contexts, especially in MOOCs and university online learning platforms (Broadbent & Poon, 2015; Lee, Watson, & Watson, 2019; Van Halem et al., 2020), professional learning settings present distinct motivational and contextual conditions. Professionals participate in online learning alongside job demands and organisational expectations, and they often evaluate relevance in terms of workplace applicability rather than formal assessment (Endedijk & Cuyvers, 2022; Wan, Compeau, & Haggerty, 2012; Men et al., 2023). This has led to calls for models of Self-Regulated Professional Learning (SRpL) that explicitly account for the contextual, motivational, and organisational constraints of workplace learning, rather than assuming that models developed for university students transfer directly to working adults (Cuyvers, Van den Bossche, & Donche, 2020; Endedijk & Cuyvers, 2022; Muljana & Luo, 2023; Wan et al., 2012). In this regard, professional learners regulate under time scarcity, competing priorities, and varying organisational pressures, which shape both how they self-regulate and whether they persist (Milligan & Littlejohn, 2014; Men et al., 2023).
How to measure SRL in such contexts remains a major methodological challenge. Traditional approaches rely heavily on self-report questionnaires such as the Motivated Strategies for Learning Questionnaire (MSLQ), which capture learners’ perceptions of their own regulation strategies (Pintrich, 1991; Panadero et al., 2016). These instruments assess sub-processes including goal setting, strategic planning, task strategies, elaboration, self-evaluation, and help-seeking (Kizilcec et al., 2017; Schunk, 2005; Zimmerman, 2000). However, self-reports are limited by recall bias and social-desirability effects (Panadero et al., 2016; Greene & Azevedo, 2010), by their inability to capture learning as it unfolds in real time (Winne et al., 2010; Winne & Hadwin, 2013), and by the difficulty of deploying them repeatedly at scale in workplace contexts (Cicchinelli et al., 2018; Crossley et al., 2016; Baker et al., 2020; Men et al., 2023).
Behavioural trace data, automatically logged during interaction with digital learning platforms, offer a complementary approach. These data record learners’ actions directly and unobtrusively, producing time-stamped indicators of how learners plan, allocate time, and interact with learning resources (Winne et al., 2010; Winne & Hadwin, 2013; Jansen et al., 2020; Men et al., 2023). When interpreted within an explicit theoretical frame, such traces can illuminate observable manifestations of SRL processes, including goal setting, monitoring, help-seeking, and self-evaluation (Kizilcec et al., 2017; Winne, 2020; Winne & Hadwin, 2013).
Because self-report and trace data capture complementary facets of SRL, perceived strategy use versus enacted behaviour, recent work advocates triangulating both to obtain a fuller account of how learners regulate their learning and persist (Van Halem et al., 2020; Kizilcec et al., 2017; Maldonado-Mahauad et al., 2018; Jansen et al., 2020). Self-reports illuminate learners’ intentions and perceived strategies, whereas trace data reveal how these strategies are enacted in practice (Winne, 2020; Li, Baker, & Warschauer, 2020). Studies in MOOCs and higher-education settings show that trace-based indicators of SRL strategies, for instance goal planning, time management, or help-seeking behaviours, tend to correlate with persistence and performance, and can help identify learners at risk of dropout (Kizilcec et al., 2017; Moreno-Marcos et al., 2020; Wong et al., 2021; Ye & Pennisi, 2022). However, most of this research has focused on academic learners, leaving professional contexts comparatively underexplored.
Corporate Learning Experience Platforms (LXPs) – AI-driven environments designed to support personalised, skills-based professional development – are becoming central to workplace learning (Valdiviezo & Crawford, 2020; Men et al., 2023). Yet little is known about how SRL manifests in these systems or how early learning behaviours relate to course completion or dropout.
This study addresses that gap by examining how self-reported and trace-based indicators of SRL relate to early dropout in a professional online learning course delivered through a corporate LXP. We focus on the first week of learning activity to test whether early SRL-related behaviours and self-perceived strategies can be used to (a) predict dropout, (b) identify combinations of strategies associated with persistence, and (c) distinguish different learner profiles (e.g., early dropouts versus completers). By analysing a real-world professional learning context, where participation competes with work obligations and is shaped by organisational expectations rather than grades, this study contributes to a more contextually grounded account of SRL and Self-Regulated Professional Learning in the workplace (Cuyvers et al., 2020; Endedijk & Cuyvers, 2022; Men et al., 2023; Valdiviezo & Crawford, 2020). It also lays the groundwork for developing targeted SRL-support interventions and early-warning approaches tailored to professional learners, who regulate under structural and temporal constraints distinct from those of traditional students (Milligan & Littlejohn, 2014; Wan et al., 2012; Men et al., 2023).
This study investigates how self-regulated learning (SRL) strategies, captured through both self-reports and trace data, relate to early dropout in a professional online learning environment. Specifically, we examine whether early SRL behaviours during the first week of the course can help predict dropout, how different strategies might interact in that prediction, and whether distinct learner profiles (e.g., early dropouts vs. completers) can be identified based on these patterns.
The SRL strategies examined include goal setting, strategic planning, task strategies, elaboration, help seeking, and self-evaluation. These are measured both via an adapted self-report instrument and through trace-based behavioural indicators such as time spent on the platform, the number of distinct interaction types (e.g., watching a video, posting in a forum, attempting a quiz, or accessing supplementary materials), and participation in course discussions. These behavioural indicators serve as proxies for SRL processes and are drawn from learners’ activity during the first week of the course.
Hypothesis 1. We hypothesise that trace data indicators of SRL (such as time spent on the platform, number of distinct interaction types, and forum participation during the first week) will be stronger predictors of dropout than self-reported SRL strategies. This builds on recent findings showing that learners’ actual behaviour, captured through digital traces, can provide a clearer and more objective picture of engagement than self-reports. Ye and Pennisi (2022) found that behavioural data from learning platforms were more accurate at predicting learner performance than self-reported strategies. Winne (2017) emphasised that trace data provide observable and real-time indicators of how learners monitor and control their learning. Moreno-Marcos et al. (2020) demonstrated that event-based SRL sequence patterns can serve as strong predictors of learning outcomes, whereas self-reported SRL strategies and demographic variables showed little to no predictive power. Based on this evidence, we expect that early behavioural engagement captured through trace data will be more effective for identifying learners at risk of dropping out than survey-based measures.
Although individual SRL strategies have been linked to academic success, there is limited empirical evidence on how specific combinations interact to predict dropout, particularly in professional learning contexts. Therefore, this research question is framed as exploratory.
Prior studies have used clustering approaches to group learners by SRL-related behaviours in MOOCs and online learning settings (e.g., Kizilcec et al., 2017; Maldonado-Mahauad, 2018). While these studies highlight the potential of behavioural data to uncover meaningful engagement profiles, findings vary across platforms and populations. As this area remains underexplored in professional learning contexts, this question is also treated as exploratory.
A total of 42 employees participated in this study. All participants were employees of CrossKnowledge, a global provider of LXPs and digital learning solutions for corporate environments (CrossKnowledge, n.d.). Participants were recruited via internal email invitations and voluntarily enrolled in a professional online learning course hosted on the CrossKnowledge platform. Enrolment was open until the official start of the course, and 42 participants had registered by that time.
Once enrolled and logged into the platform, learners gained access to the first week of course content, which they could follow at their own pace. The course was designed for asynchronous learning, meaning participants could complete activities at their own pace rather than following a fixed schedule and there were no fixed deadlines or time-bound requirements.
Demographic data such as age, gender, education level, and job role were not collected due to internal company policies designed to protect participant anonymity. Although no individual motivational data were gathered, the course was part of the company’s broader professional development programme, which encourages employees to engage in online learning to strengthen workplace competencies and support career growth. The company also allows employees to dedicate a limited number of work hours to professional development activities, though actual participation times likely varied depending on individual schedules and flexibility.
Informed consent was obtained from all participants at the start of the course via a digital consent form that explained the purpose of the research, the types of data collected (e.g., self-report surveys and trace data), and assurances that participation was voluntary and could be withdrawn at any point without penalty. All data were processed in accordance with GDPR regulations, anonymised during analysis, and stored on secure institutional servers to protect participant confidentiality.
The online course, designed to improve learning among professionals, ran for four weeks. Over this period, learners were introduced to seven elements associated with enhanced learning: urgency, action and sharing, hybrid learning, learner agency, collaboration and coaching, flexibility, and assessment as learning. Each week’s content was released at the beginning of the week and included short 2 to 3-minute videos, text summaries, infographics, and discussion prompts in an online forum. An adapted version of the Motivated Strategies for Learning Questionnaire (MSLQ) (see Appendix) was embedded within the first week’s content to capture self-reported SRL strategies. All behavioural activity on the learning platform was automatically recorded. Access to the trace data was provided only after the course had ended and enrolment and participation were closed. The course took place from October 5, 2020, to October 30, 2020, and the dataset used in this project was provided by CrossKnowledge.
3.3.1 Dependent variable - dropout
Dropout was defined as a binary variable: 1 = dropout, 0 = completer. A learner was classified as a dropout if they met both of the following criteria: (a) they were inactive on the platform for two or more weeks, and (b) they had a total course score below 138 points. Each week, learners earned points based on their engagement with and completion of course activities. The total course score was calculated by summing these weekly points across the four-week course. We then computed the total scores for all 42 participants and used the median of these values, 138 points, as the cutoff. The median was chosen over the mean to reduce the influence of extreme values and better reflect the central tendency of learner performance. This 138-point threshold, when combined with the two-week inactivity period, was used to classify dropouts: only learners who met both conditions, prolonged inactivity and a score below 138, were labelled as dropouts (1). Learners who maintained regular activity and had scores at or above the median were classified as completers (0). Inspired by Moreno-Marcos et al. (2020), this combined criterion captures both behavioural disengagement and limited learning progress, helping to distinguish true dropouts from learners who may have been briefly inactive or only minimally engaged. In the absence of a universal definition of dropout in online learning, this approach offers a data-driven and context-sensitive operationalisation.
3.3.2 Independent variables – SRL survey (self-reported)
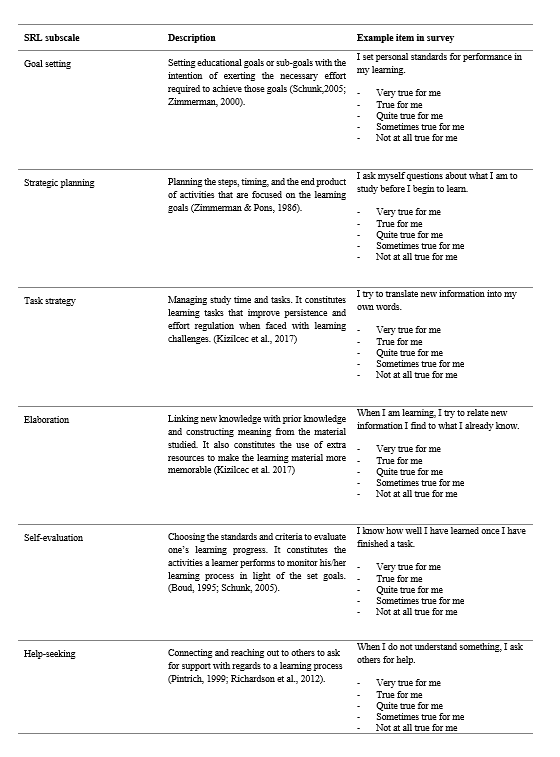
The self-report survey used to assess SRL strategies in this study is an adapted version of the Motivated Strategies for Learning Questionnaire (MSLQ; Pintrich, 1991), as further developed for online learning environments by Kizilcec et al. (2017). The adapted instrument focuses on six subscales: goal setting, strategic planning, task strategies, elaboration, self-evaluation, and help-seeking.
To reduce respondent burden and improve participation in a professional learning context, we used a shortened version of the 24-item instrument from Kizilcec et al. (2017). This reduction was made in consultation with the first author of that study, who suggested either removing entire subscales that were not central to the study’s goals or reducing each subscale by one item. For the help-seeking subscale specifically, the author recommended removing the reverse-coded item. For the remaining subscales, the choice of which item to remove was guided by perceived redundancy, where two items expressed a similar behaviour, the one judged less distinct or clear in the professional context was removed. This pragmatic reduction aimed to minimise respondent fatigue, which is known to be a risk in online surveys and is increasingly acknowledged as a challenge including in workplace-based surveys as well (Galesic & Bosnjak, 2009; Kato & Miura, 2021; Smith et al., 2003).
The final adapted survey consisted of the following number of items per subscale: Goal Setting: 3 items, Strategic Planning: 3 items, Task Strategies: 5 items, Elaboration: 2 items, Self-Evaluation: 2 items & Help-Seeking: 3 items. The full version of the adapted survey is provided in the Appendix, where items that were removed during the adaptation process are also clearly marked for full transparency.
Participants rated each item on a 5-point Likert scale from Not at all true for me (1) to Very true for me (5). Scores for each subscale were computed as the sum of their items. Due to differing subscale lengths, theoretical maximum scores ranged from 10 (for 2-item subscales) to 25 (for 5-item subscales).
In Kizilcec et al. (2017), the full version of the adapted instrument demonstrated strong internal consistency, with Cronbach’s α ranging from 0.75 to 0.86 across subscales. In our study, internal consistency values were lower and more variable, likely due to the small sample size (n = 32 for the survey data) and the reduced number of items per subscale. The Cronbach’s α coefficients for each subscale in the present study are provided in Supplementary Table S1.
Table 1
SRL survey subscales - Descriptions and example
3.3.3 Independent variables – SRL indicators from trace data
In this study, we use the term engagement to refer specifically to behavioural engagement, consistent with SRL frameworks in online learning (Winne, 2020; Jansen et al., 2020; Li, Baker, & Warschauer, 2020). Behavioural engagement was operationalised through trace-based indicators reflecting learners’ observable activity on the platform during Week 1, including time spent, diversity of actions performed, participation in discussions, and completion of planning or evaluative tasks. These indicators are interpreted as behavioural proxies of SRL-related processes such as time management, goal setting, help-seeking, and self-evaluation, rather than as direct measures of underlying cognitive or motivational states.
Building on this conceptualisation, we analysed learners’ early behavioural indicators of SRL by mapping each Week 1 trace data variable to an SRL phase and corresponding strategy, following the established cyclical model of SRL (Zimmerman & Moylan, 2009) and recent empirical mappings in online learning research (Kizilcec et al., 2017; Jansen et al., 2020; Maldonado-Mahauad et al., 2018). This mapping provides a theoretically grounded framework for interpreting observed learner behaviours as proxies for underlying self-regulatory processes. Table 2 summarises the trace data variables, their operational definitions, and their theoretical alignment with SRL phases and strategies.
Table 2
Mapping of trace data variables to SRL phases and strategies based on theoretical models.
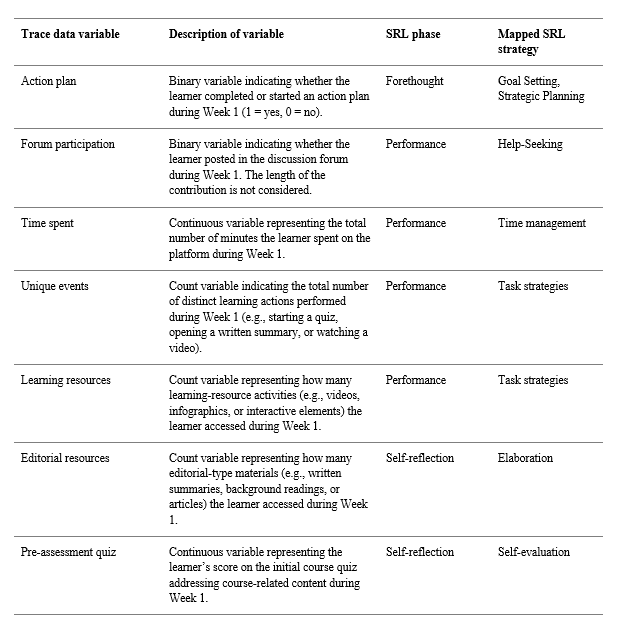
Unique events refers to the total count of distinct types of learner actions performed by each user during Week 1 of the course. These include activities such as watching a video, contributing to a forum, completing a quiz, or accessing supplementary materials. This indicator reflects the diversity of interaction types rather than the frequency of actions and serves as a proxy for task strategies and engagement breadth (Jansen et al., 2020; Li, Baker, & Warschauer, 2020).
The Action plan variable reflects both Goal setting and Strategic planning, as it prompts learners to define their objectives and outline steps to achieve them. These processes correspond to the Forethought phase of SRL (Zimmerman & Moylan, 2009). Prior research has shown that planning activities such as completing an action plan are associated with increased course completion rates (Yeomans & Reich, 2017) and effective goal regulation (Jansen et al., 2020).
Time spent on the platform serves as a proxy for time management, a key strategy in the Performance phase of SRL (Zimmerman & Moylan, 2009). Similarly, participating in discussion forums is interpreted as a form of help-seeking behaviour, also within the Performance phase, and has been linked to better learner engagement and regulation (Jansen et al., 2020; Van Halem et al., 2020). In this dataset, Action plan completion and Forum participation were both exported by the platform as binary indicators of whether the learner engaged in that activity during Week 1.
Action plan was coded 0 = no and 1 = yes, and Forum participation was coded 0 = no and 2 = yes. For all analyses, both variables were modelled as binary participation indicators (engaged vs. not engaged), irrespective of the underlying numeric scale in the export. This preserves their interpretation as presence or absence of the relevant self-regulatory behaviour (goal planning, help-seeking) and does not affect inferential results.
Taking quizzes, particularly pre-quizzes, is indicative of self-evaluation and monitoring strategies, which fall under the Self-reflection phase. These activities require learners to assess their understanding and adjust future study strategies accordingly (Zimmerman & Moylan, 2009; Jansen et al., 2020).
Engagement with supplemental text summaries (editorial resources) following course videos (learning resources) reflects the strategy of elaboration, which involves using additional resources to deepen understanding and retention (Kizilcec et al., 2017). These editorial-type activities are mapped to elaboration strategies and to self-reflection processes within SRL, as they involve reviewing and consolidating course material (Kizilcec et al., 2017; Zimmerman & Moylan, 2009).
All analyses were conducted using R (R Core Team, 2023) and the RStudio IDE (RStudio Team, 2023). Process maps were generated using Fluxicon Disco. To address the study’s research questions, we employed a combination of traditional statistical methods and machine learning (ML) approaches, balancing interpretability and exploratory discovery within the constraints of a small sample size.
A dual analytic strategy integrating confirmatory and exploratory perspectives was applied. Logistic regression and decision-tree analyses tested theoretically derived SRL predictors of dropout (top-down), while hierarchical clustering and process-mining analyses explored emergent behavioural patterns without predefined groupings (bottom-up). Using both approaches enabled the validation of theory-driven expectations and the discovery of unanticipated patterns of self-regulated learning in professional contexts.
For RQ1, which examined the predictive value of SRL indicators, we used binary logistic regression to assess whether self-reported and trace-based SRL variables predicted dropout. Logistic regression was selected because it provides interpretable results in the form of odds ratios and is widely used for binary outcomes such as course dropout versus completion (Hosmer, Lemeshow, & Sturdivant, 2013). It is also appropriate for modest-sized datasets, where more complex models may not perform reliably.
To better understand how well each individual self-regulated learning (SRL) variable could predict dropout, we also performed Receiver Operating Characteristic (ROC) analysis. This method tests how accurately a variable can separate two groups, learners who completed the course and those who dropped out, by comparing the true positives and false positives at different cutoff points. The Area Under the Curve (AUC) provides a single number to summarise this performance, where 0.5 indicates no better than chance and 1.0 indicates perfect prediction. We used the pROC package to calculate AUC values (Robin et al., 2011) and visualised the results with ggplot2 (Wickham, 2016).
To address RQ2, we used a Decision Tree classifier implemented via the rpart package to explore how combinations of SRL indicators interacted to differentiate dropouts from completers. Decision trees were selected because they can model non-linear relationships and detect interaction effects without requiring assumptions such as linearity or normality, assumptions often violated in educational trace data (Halawi, Clarke, & George, 2022).
For RQ3, which focused on identifying distinct learner profiles, we applied Agglomerative Hierarchical Clustering (HCA) using Ward’s method and Euclidean distance. HCA is an unsupervised machine learning technique well-suited for exploratory pattern discovery, as it does not require the number of clusters to be specified in advance (Jain et al., 1999). Clustering was complemented by process mining visualisations, which provided a descriptive, event-based comparison of learner trajectories between dropouts and completers.
While ML methods such as decision trees and clustering offer flexibility in uncovering complex, non-linear patterns, they are also sensitive to overfitting and typically require larger datasets for robust generalisation. By combining traditional statistical models with exploratory ML techniques, we aimed to balance hypothesis-driven testing with data-driven pattern discovery, fitting the exploratory aims and sample constraints of this study.
Descriptive statistics for all variables are presented in Table 3 (survey-based variables) and Table 4 (trace-based variables). Among self-reported measures, only Goal setting was significantly associated with dropout (r = -0.38, p < .05), suggesting that learners with higher goal-setting scores were less likely to drop out. Other subscales such as task strategies, elaboration, and help-seeking did not significantly predict dropout in this sample.
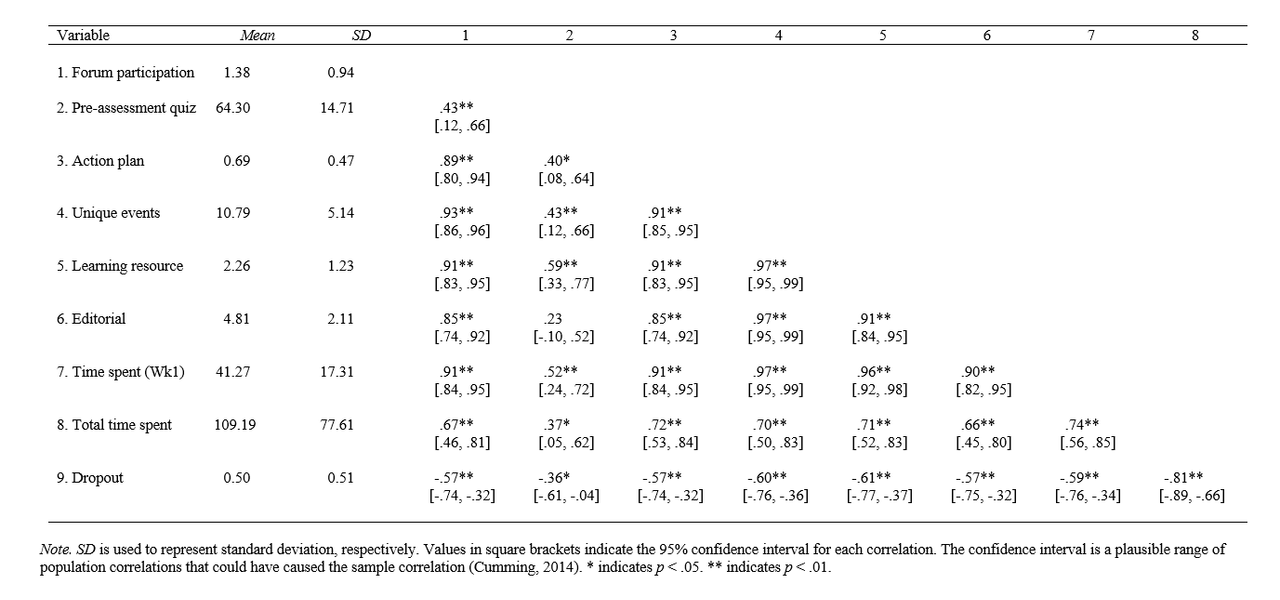
In contrast, trace data variables showed stronger and more consistent correlations with dropout. All seven trace variables were significantly negatively correlated with dropout (p < .05 or p < .01). Notably, the number of unique events in Week 1 (r = -0.60), time spent on the platform during Week 1 (r = -0.59), and total time spent throughout the course (r = -0.81) were among the strongest predictors.
Table 3
Means, standard deviations, and correlations between independent survey variables and the dependent variable ‘dropout’
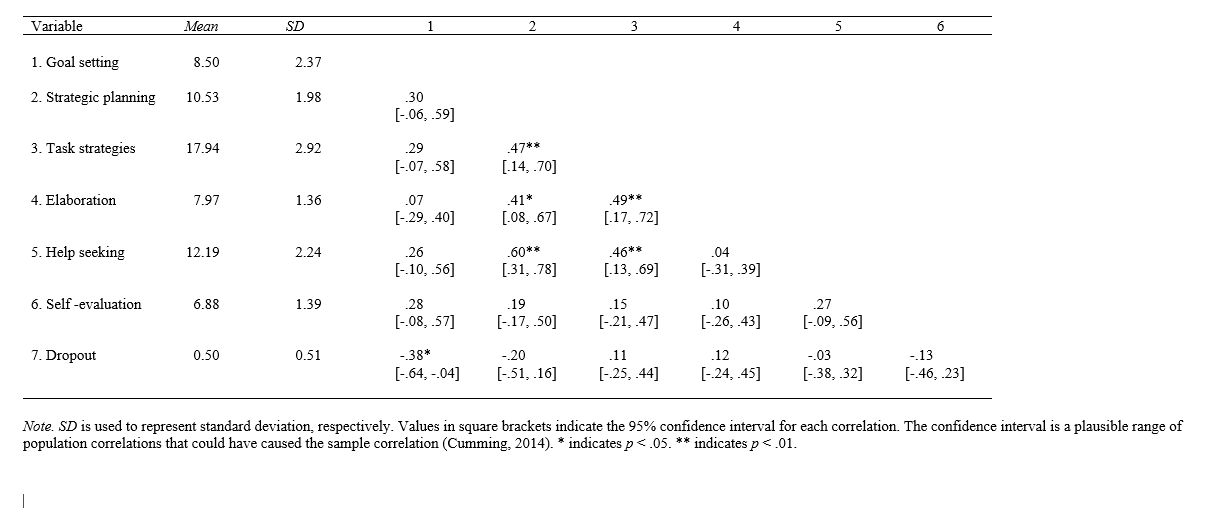
Table 4
Means, standard deviations, and correlations between independent trace data variables and the dependent variable ‘dropout’
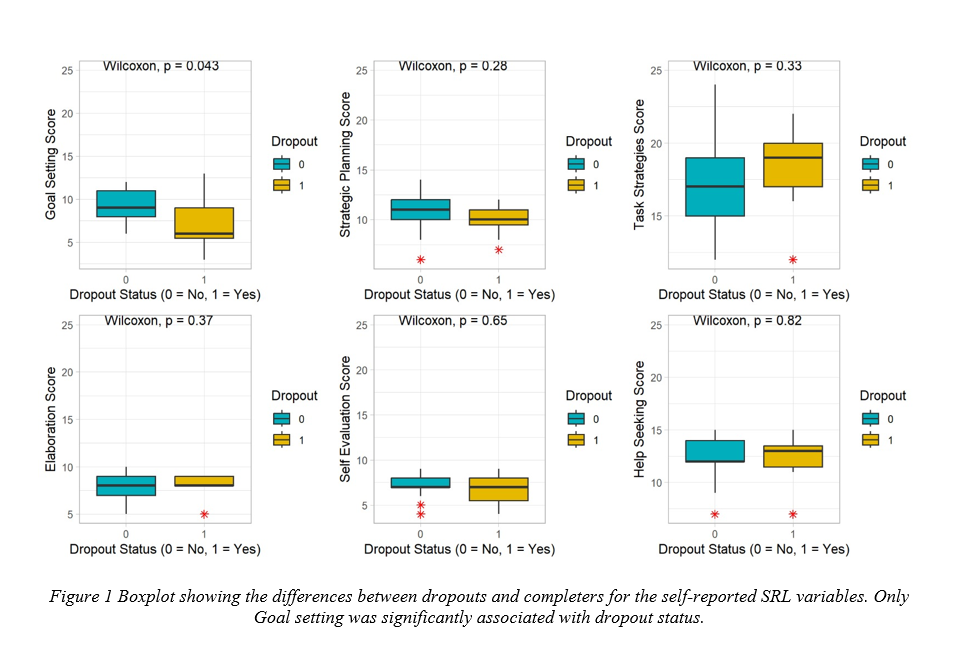
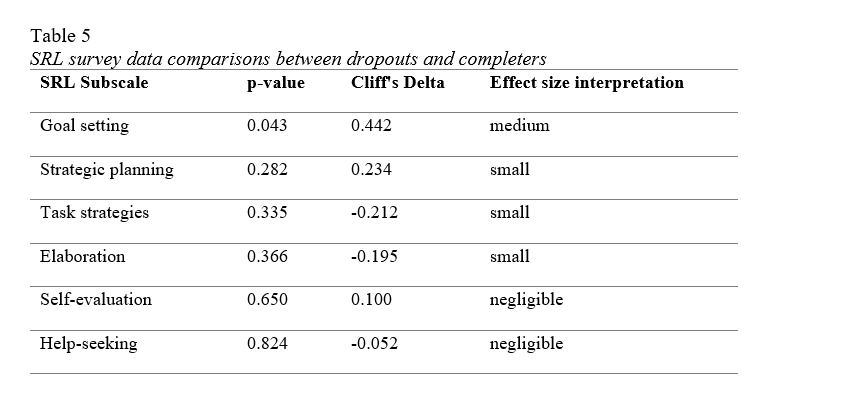
To examine whether self-reported use of self-regulated learning (SRL) strategies differed between learners who dropped out and those who completed the course, Wilcoxon rank-sum tests were conducted for each SRL survey subscale (see Figure 1 and Table 5). This non-parametric test was selected due to the small sample size and the ordinal nature of the Likert-scale survey data, which may violate the normality assumptions required for parametric tests. Group comparisons were not conducted for the trace-based SRL variables, as many were binary in nature (e.g., Action plan: yes = 1, no = 0), rendering Wilcoxon tests inappropriate. In addition, differences in trace variables were already examined in the logistic regression and decision tree analyses, which provided a more comprehensive assessment of their predictive value for course dropout.
Boxplots (Figure 1) were used to visualise the distribution of SRL survey scores across groups. Outliers were identified using Tukey’s method (1.5 × interquartile range) and are indicated with asterisks. These visualisations facilitate interpretation of score variability and highlight potential differences between completers and dropouts.
The Wilcoxon tests revealed a statistically significant difference in Goal Setting scores between dropouts and completers (p = 0.043), with a medium effect size (Cliff’s δ = 0.442). No statistically significant differences were observed for the remaining survey subscales. These findings suggest that higher self-reported use of goal-setting strategies was associated with course completers, while other reported SRL strategies did not differ significantly between groups.
To test the predictive value of each SRL indicator, we conducted separate logistic regression analyses for the self-reported (Table 6) and trace-based variables (Table 7). Among the self-reported SRL strategies, only Goal setting emerged as a significant predictor of dropout (β = −0.38, p = .045). The model yielded a McFadden’s pseudo-R² of 0.12, which corresponds to a modest improvement in how well the model predicts dropout compared with a model containing no predictors.
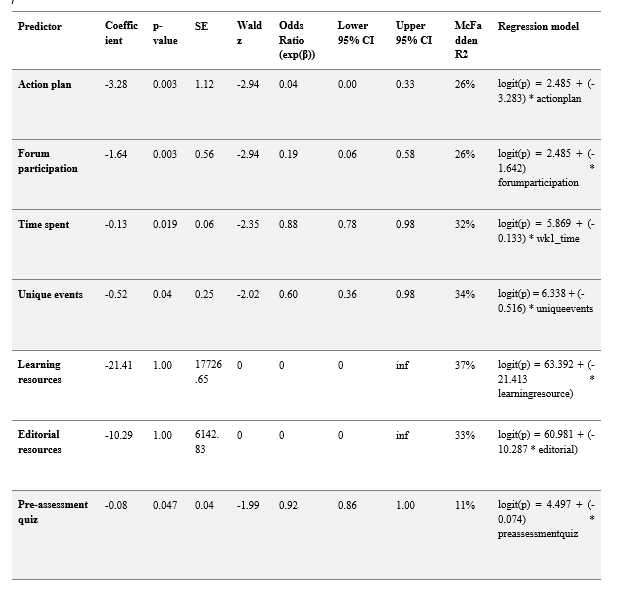
In contrast, several trace-based indicators were significant predictors. The number of Unique events in Week 1 was a strong predictor (β = −0.52, p = .043; pseudo-R² = 0.34). Time spent in Week 1 also showed significant predictive value (β = −0.13, p = .019; pseudo-R² = 0.32). Additionally, Action plan completion (β = −3.28, p = .003; pseudo-R² = 0.26) and Forum participation (β = −1.64, p = .003; pseudo-R² = 0.26) each substantially improved model fit. Finally, the Pre-assessment quiz Score (β = −0.08, p = .047; pseudo-R² = 0.11) contributed modestly to model performance.
Interpretation of the odds ratios indicated that higher survey Goal setting scores were associated with a 32% reduction in the odds of dropout (OR = 0.68, 95% CI [0.47, 1.00]). For trace-based indicators, spending more time on the course during the first week was associated with a 12% reduction in dropout odds (OR = 0.88, 95% CI [0.78, 0.98]). Completing more Unique events during the first week reduced dropout odds by 40% (OR = 0.60, 95% CI [0.36, 0.98]). Completing the Action plan was associated with a 96% reduction in dropout odds (OR = 0.04, 95% CI [0.00, 0.33]), and participating in the Forum was associated with an 81% reduction (OR = 0.19, 95% CI [0.06, 0.58]). Higher Pre-assessment quiz scores were associated with a 7% reduction in dropout odds (OR = 0.92, 95% CI [0.86, 1.00]).
Table 6
Summary of logistic regression analysis predicting dropout from self-reported SRL survey data collected during the first week. Statistically significant variables are highlighted.
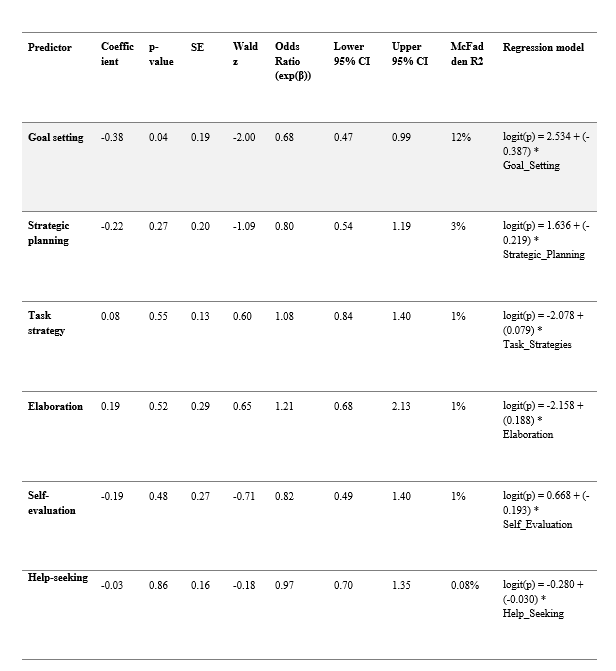
Table 7
Summary of logistic regression analysis predicting dropout based on SRL-related trace data from the first week. Statistically significant variables are highlighted.
Following the logistic regression analysis, Receiver Operating Characteristic (ROC) analyses were conducted to evaluate the predictive performance of individual self-regulated learning (SRL) measures and indicators for learner dropout. Each logistic regression model included only one predictor, allowing us to assess the unique association between each SRL variable and dropout. The subsequent ROC analysis provided a complementary view by quantifying how well each individual variable could distinguish between learners who dropped out and those who completed the course. In ROC analysis, the Y-axis represents sensitivity (true positive rate, correctly identifying dropouts), and the X-axis represents 1 − specificity (false positive rate, incorrectly identifying completers as dropouts). AUC values range from 0.5 (no predictive value) to 1.0 (perfect discrimination), with values above 0.7 considered acceptable and values above 0.8 considered strong indicators of predictive utility.
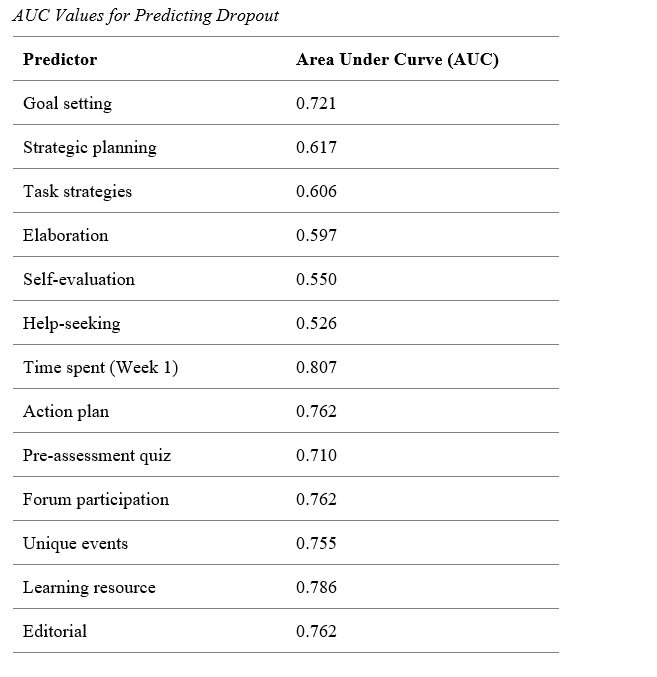
Among the survey-based SRL measures, Goal Setting demonstrated the strongest discriminative ability (AUC = 0.721) (see Figure 2 and Table 8) among the survey variables. These results indicate that Goal Setting was the most effective self-reported predictor of dropout, although its predictive strength was moderate.
In contrast, SRL trace data variables exhibited stronger overall predictive performance. Time spent during Week 1 yielded the highest AUC (0.807), followed by Learning resource engagement (AUC = 0.786), Action plan completion (AUC = 0.762), Forum participation (AUC = 0.762) and Editorial usage (AUC = 0.762) as shown in Figure 3 and Table 8.
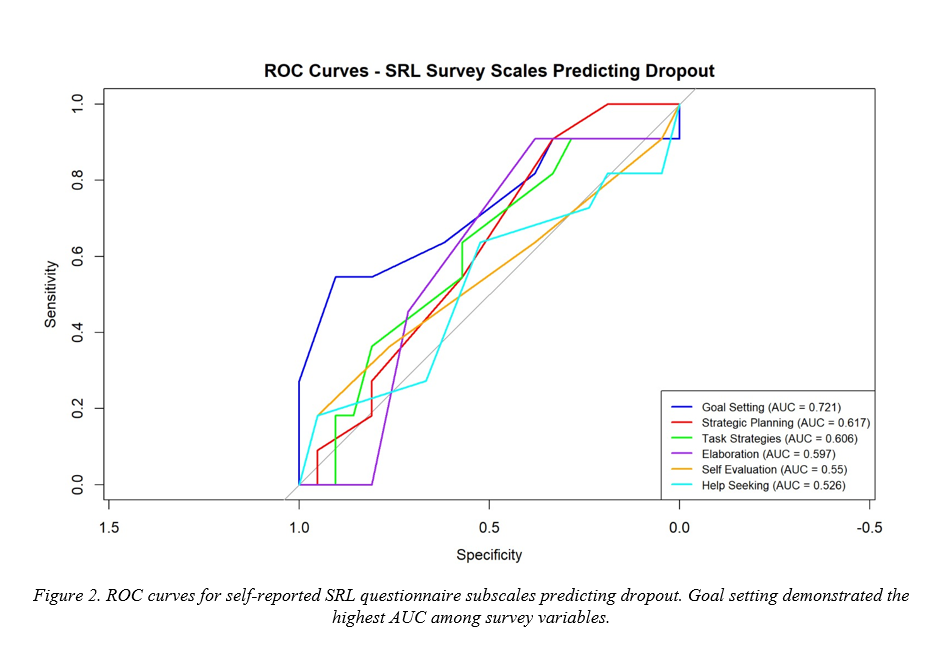
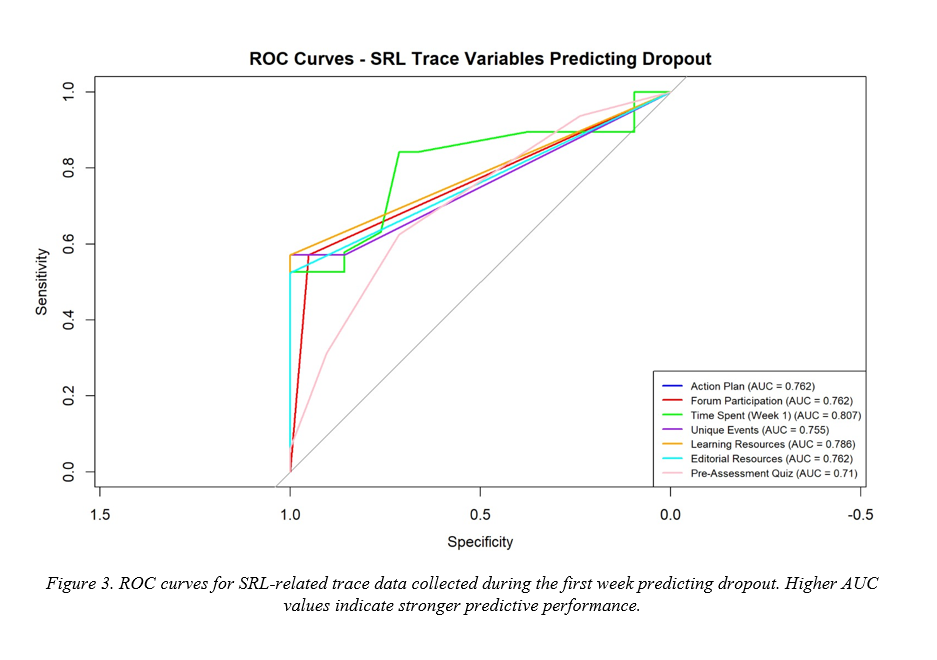
Table 8
AUC Values for Predicting Dropout
To investigate which combinations of SRL indicators best predict dropout, a Decision Tree classifier was constructed using all variables identified as significant in the univariate analyses. In decision tree modelling, splits are selected based on maximising information gain, that is, reducing classification uncertainty at each step.
The resulting tree (see Figure 4) revealed that the total number of Unique Events (total_events) during the first week was selected as the root node, as it provided the greatest reduction in impurity compared to all other variables. Learners who performed fewer than 10 unique events in Week 1 were highly likely to drop out. Among those with 10 or more unique events, survey Goal setting scores emerged as the next most informative split: learners with a survey Goal setting score below 7 had a dropout risk of 71%. For learners with higher survey Goal setting scores (≥7), Time spent in Week 1 (wk1_time) served as the final major split: learners spending less than 49 minutes showed a 33% dropout risk, while those exceeding 49 minutes had a substantially lower dropout risk of 7%.
While other SRL-related variables (e.g., Forum participation, Pre-assessment quiz, Action plan) were significant in prior analyses, they were not selected for splitting because they contributed less to immediate impurity reduction relative to the variables ultimately chosen. This dynamic prioritisation is a feature of decision tree algorithms, which seek the most powerful classifier at each node rather than relying solely on global statistical significance.
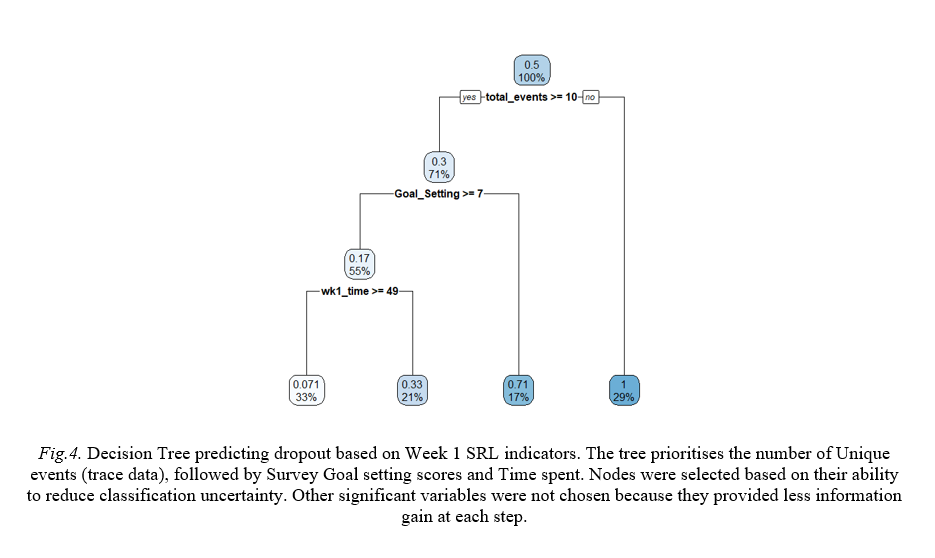
These findings reinforce that early behavioural engagement (captured by unique platform interactions), and intentional goal setting are key determinants of learner persistence. The hierarchical dominance of Unique events as the root node further highlights its strength as an early behavioural predictor of dropout risk.
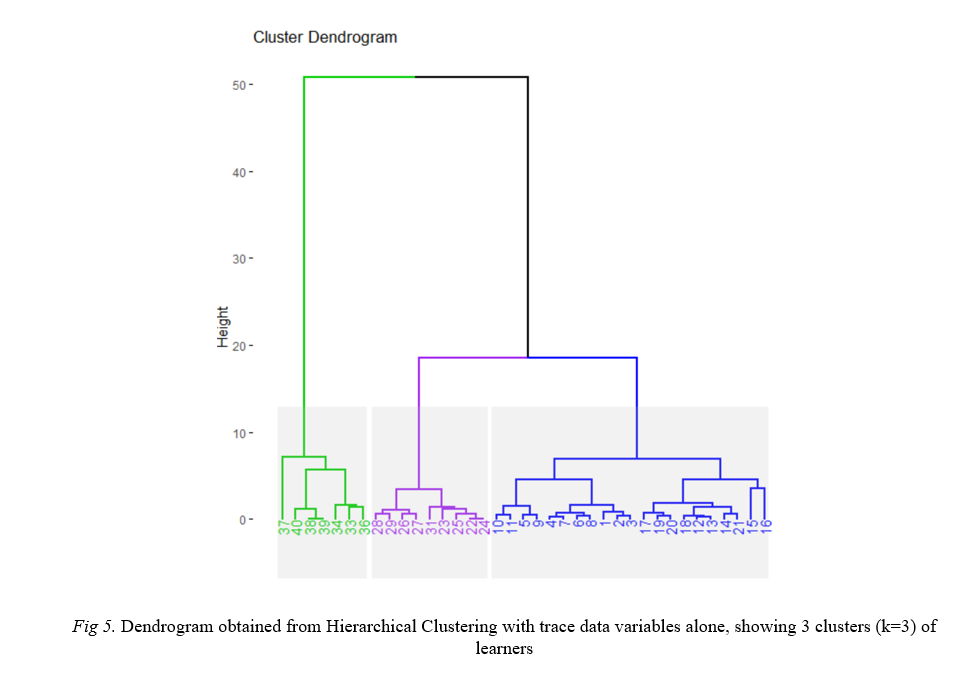
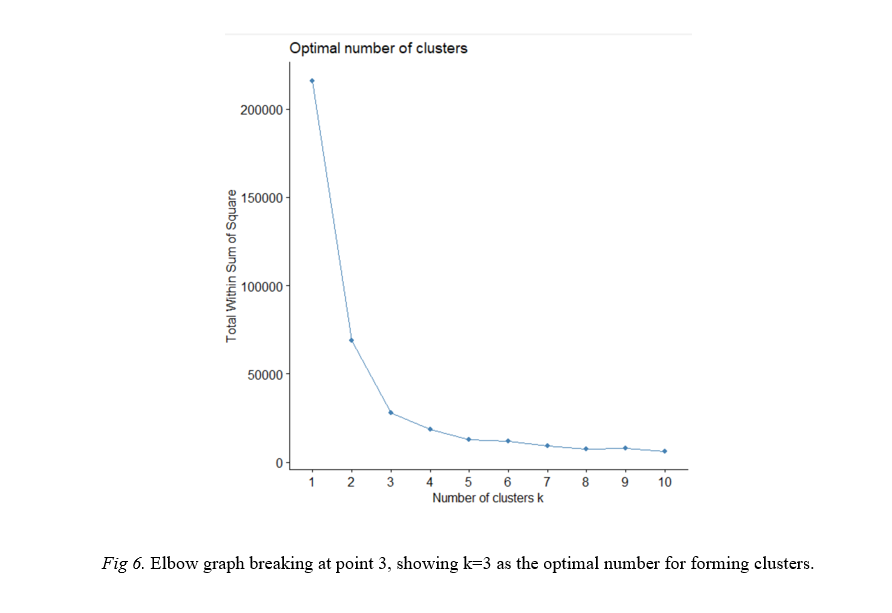
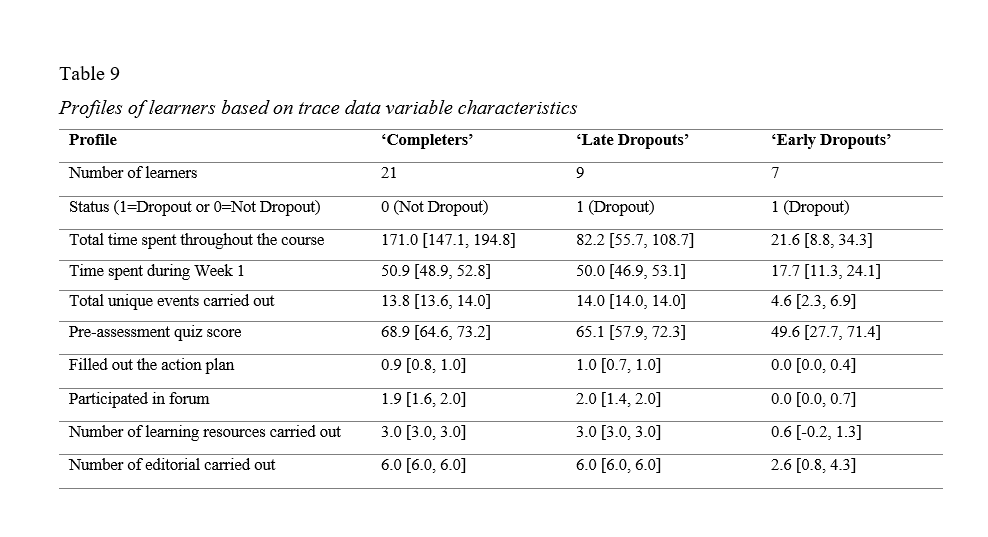
To identify learner profiles, Agglomerative Hierarchical Clustering (HCA) was applied to the Week 1 trace data. In this method, each participant initially started as an individual cluster, and clusters were progressively merged based on similarity until the final structure emerged. Based on the dendrogram (Figure 5) and the elbow plot (Figure 6), a three-cluster solution was selected as optimal. The resulting clusters were interpreted as follows: the first group, Completers (n = 21), exhibited high levels of SRL behaviour and sustained engagement throughout the course; the second group, Late dropouts (n = 9), showed similar initial SRL behaviours but eventually disengaged; and the third group, Early dropouts (n = 7), displayed low levels of SRL activity and disengaged within the first week. Cluster characteristics and comparisons are summarised in Table 9. Early dropouts performed fewer actions, spent significantly less time on the platform, and completed fewer resources compared to the other two groups. Although Late dropouts initially resembled Completers in their Week 1 activity levels, their subsequent disengagement highlights the complexity of predicting long-term persistence and underscores the importance of developing more tailored support strategies to maintain learner engagement over time.
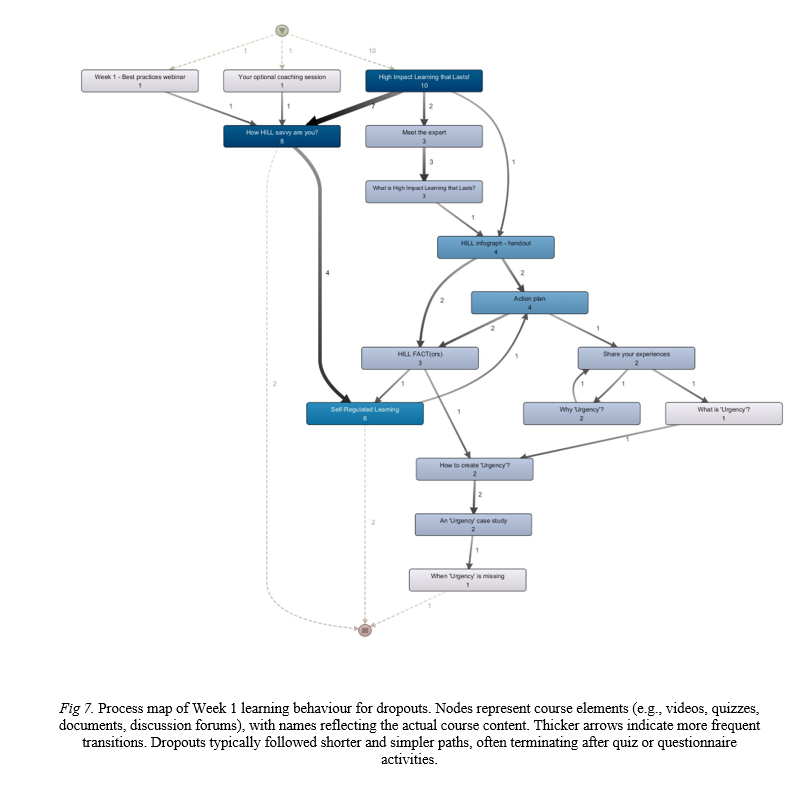
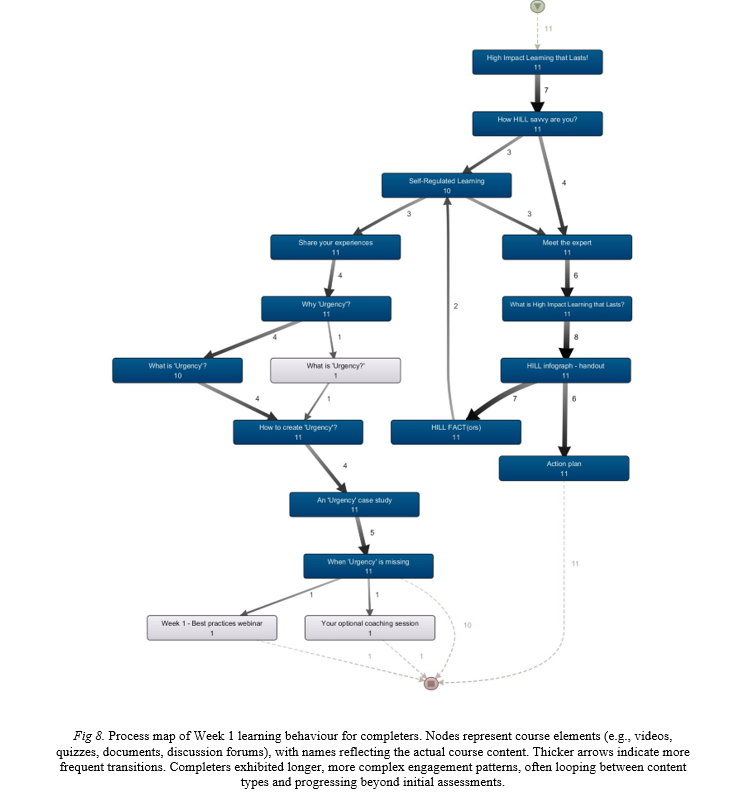
Process maps of Week 1 learning behaviour were generated for dropouts and completers using Fluxicon Disco (see Figures 7 and 8). In these maps, nodes (rectangles) represent different types of learning activities, such as reading a document, watching a video, completing a quiz, or participating in a discussion forum. The edges (arrows) represent transitions between activities, where learners move from one content element to another. The thickness of each arrow reflects the frequency of that transition, thicker arrows indicate more learners following that path, and the numbers on the arrows display the exact count of learners who made that specific transition along the visualised path. The numbers inside the nodes show the total number of learners who visited that activity, including those who arrived through less common paths not shown in the figure. For example, the node labelled 'How HILL savvy are you?' shows that 11 learners accessed this quiz, but only 7 learners followed the direct transition from 'High Impact Learning that Lasts!' to it; the remaining learners arrived through alternative paths that were too infrequent to be displayed. Process mining software typically filters out less frequent paths to maintain figure clarity, so not all movement between activities is fully visualised.
The names inside the nodes correspond to specific course elements that learners interacted with. For example, 'How HILL savvy are you?' and 'Self-Regulated Learning' refer to a quiz and a questionnaire, respectively. 'Meet the expert' and 'How to create urgency' are video lectures, while 'Share your experiences' refers to a discussion forum activity where learners were encouraged to discuss topics and ask questions.
Dropouts typically exhibited simpler and shorter sequences, often terminating shortly after completing a quiz or questionnaire. Their process maps show fewer transitions between different content types and lower overall activity frequency. Quiz activities frequently marked the final step for dropouts, indicating an abrupt disengagement after confrontation with assessment tasks.
In contrast, completers followed longer, more interconnected learning paths. Their maps reveal more frequent and complex transitions between various content types, such as moving from a video to a document and then to a quiz, often looping back to previous materials. Completers not only completed quizzes but also continued engaging with other resources afterward, suggesting a deeper and more sustained learning approach. These visualisations illustrate that the depth, continuity, and diversity of engagement during the first week are key indicators distinguishing learners at risk of early dropout from those likely to persist and succeed.
This study examined the predictive value of trace-based and self-reported indicators of self-regulated learning (SRL) in a professional online learning environment delivered through a corporate Learning Experience Platform (LXP). Extending SRL research beyond academic settings (e.g., Kizilcec et al., 2017; Broadbent & Poon, 2015), it addressed the professional learning context, where motivation, time constraints, and organisational expectations shape how learners engage and persist. By integrating behavioural trace data, survey measures, and complementary analytic techniques (logistic regression, decision trees, clustering, and process mining), the study provides a multi-layered view of how early SRL-related behaviours relate to dropout and course completion.
Across analyses, trace-based indicators of SRL were stronger predictors of early dropout than self-reported strategies. Among these, Action plan completion, a behavioural proxy for goal setting, and Unique events, a proxy for task strategy diversity, showed the most consistent associations with persistence, aligning with findings from Moreno-Marcos et al. (2020), Kizilcec et al. (2017), and Wong et al. (2021). These results suggest that early, enacted SRL behaviours, particularly planning and diverse engagement, serve as meaningful early signals of sustained participation. In contrast, among self-reported measures, only Goal setting was significant, indicating that perceived strategy use may not always translate into action in professional learning contexts.
The decision tree and cluster analyses further revealed that SRL behaviours interact in complex, non-linear ways: combinations of low goal setting and limited early engagement were associated with higher dropout likelihood, whereas learners who combined clear goal setting with moderate early engagement (e.g., ≥10 unique actions and >49 minutes on the platform) were unlikely to drop out. Notably, Late Dropouts, who initially resembled Completers but disengaged later, illustrate that early engagement alone may not sustain long-term participation, which likely also depends on motivational and contextual factors.
These findings align with established SRL frameworks, which conceptualise learning as a cyclical process of planning, monitoring, and reflection. Zimmerman’s (2000) three-phase model, forethought, performance, and reflection, emphasises that effective learners plan ahead and monitor progress, while Winne and Hadwin’s (1998) model highlights adaptive control, where learners adjust strategies in response to feedback. The present results reflect these mechanisms: learners who engaged in planning behaviours (e.g., completing an action plan) and performance-related activities (e.g., diverse task engagement) were less likely to drop out. Behavioural indicators therefore serve as real-time proxies for these self-regulatory processes, complementing but not replacing self-reports that capture perceived strategy use (Winne, 2020; Tempelaar et al., 2020; Maldonado et al., 2018). Among self-reported strategies, Goal setting was most predictive, corresponding to Zimmerman’s forethought phase: learners who articulated clear goals were more likely to maintain engagement.
In professional learning contexts, where participation occurs alongside work responsibilities and organisational expectations, even small early acts of self-regulation, such as completing an action plan or posting in a forum, can differentiate those who remain engaged from those who disengage (Littlejohn et al., 2016; Milligan & Littlejohn, 2014). These findings support the adaptation of SRL theory to professional learning by integrating situational and motivational dynamics specific to working adults.
Several limitations should be noted. First, while behavioural trace data offer valuable proxies for SRL, their interpretation remains inferential: metrics like time spent or event counts reflect observable activity, but not necessarily the cognitive or motivational processes underlying self-regulation (Winne, 2020; Jansen et al., 2020). Although self-report data were also collected, we did not triangulate trace and survey data at the individual level due to ethical and privacy considerations. Future studies should explore ethically approved methods for linking multiple data sources or combine trace data with qualitative approaches, such as think-aloud protocols or interviews, to strengthen construct validity.
The small sample size limits statistical power, particularly for decision tree and clustering analyses, which are sensitive to overfitting. The dataset also derives from a single professional organisation, which may constrain generalisability. Organisational culture, platform design, or workforce composition could influence SRL behaviours and dropout patterns. Moreover, demographic data (e.g., age, gender, job role) were not collected to protect participant privacy, precluding subgroup analyses. Future research should replicate these findings across diverse professional settings and organisational contexts.
Finally, as shown in Table 2, not all trace indicators equally capture SRL processes. Some variables, such as total time on platform or number of unique events, reflect general engagement, whereas others, like Action Plan completion and forum participation, are more directly linked to self-regulatory behaviours such as goal setting, monitoring, and help-seeking (Winne & Hadwin, 1998; Maldonado et al., 2018; Jansen et al., 2020). Future work should refine these proxies to align more closely with SRL sub-processes by analysing the timing, sequence, and depth of interactions rather than frequency or duration alone.
Early behavioural indicators can inform the design of adaptive workplace learning systems capable of detecting disengagement in real time. Encouraging action planning and goal setting during the first week may strengthen the forethought phase of SRL and support sustained engagement. Because Late Dropouts initially mirrored Completers, as shown in the hierarchical clustering analysis, a single early engagement checkpoint may not suffice. Ongoing monitoring and targeted, low-intensity nudging across the course could help detect and prevent emerging disengagement before it leads to full dropout.
Decision tree and clustering models proved valuable for identifying distinct learner profiles (e.g., early and late dropouts) and visualising combinations of SRL behaviours associated with persistence. These interpretable models can guide instructional design and platform development, but they should be validated on larger, more diverse samples to enhance generalisability and capture the dynamic nature of SRL across time and contexts.
To improve predictive precision, future research should combine clickstream data with multimodal inputs, such as keystroke dynamics, eye-tracking, or learner reflection logs, to obtain finer-grained insight into cognitive and metacognitive regulation (Azevedo et al., 2017; Sharma et al., 2019; Giannakos et al., 2021; Hilpert, Greene, & Bernacki, 2023). As learning increasingly unfolds in collaborative environments, further studies should also investigate co-regulated and socially shared regulation (Hadwin et al., 2011; Järvelä & Hadwin, 2013; Malmberg et al., 2022) to understand how professionals coordinate goals and strategies within online communities.
Together, these implications highlight the potential of integrating behavioural analytics with SRL theory to design adaptive, evidence-based learning environments that better support professional learners’ persistence and success.
Azevedo, R. (2005). Computer environments as metacognitive tools
for enhancing learning. Educational Psychologist, 40(4),
193-197. https://doi.org/10.1207/s15326985ep4004_1
Azevedo, R., Taub, M., & Mudrick, N. V. (2017). Understanding
and reasoning about real-time cognitive, affective, and
metacognitive processes to foster self-regulation with advanced
learning technologies. In Handbook of self-regulation of
learning and performance (pp. 254-270). Routledge.
https://doi.org/10.4324/9781315697048-17
Baker, R., Xu, D., Park, J., Yu, R., Li, Q., Cung, B., ... &
Smyth, P. (2020). The benefits and caveats of using clickstream
data to understand student self-regulatory behaviors: opening the
black box of learning processes. International Journal of
Educational Technology in Higher Education , 17(1),
13. https://doi.org/10.1186/s41239-020-00187-1
Boud, D. (1995). Enhancing learning through self-assessment.
Routledge. https://doi.org/10.4324/9781315041520
Broadbent, J., & Poon, W. L. (2015). Self-regulated learning
strategies & academic achievement in online higher education
learning environments: A systematic review. The Internet and
Higher Education, 27, 1-13. https://doi.org/10.1016/j.iheduc.2015.04.007
Cicchinelli, A., Veas, E., Pardo, A., Pammer-Schindler, V., Fessl,
A., Barreiros, C., & Lindstädt, S. (2018, March). Finding
traces of self-regulated learning in activity streams. In
Proceedings of the 8th international conference on learning
analytics and knowledge (pp. 191-200).
https://doi.org/10.1145/3170358.3170381
CrossKnowledge. (n.d.). About us. Retrieved May 20,
2023, from https://www.crossknowledge.com/about-us/
Crossley, S., Paquette, L., Dascalu, M., McNamara, D. S., &
Baker, R. S. (2016, April). Combining click-stream data with NLP
tools to better understand MOOC completion. In Proceedings
of the sixth international conference on learning analytics
& knowledge (pp. 6-14).
https://doi.org/10.1145/2883851.2883931
Cumming, G. (2014). The new statistics: Why and how.
Psychological Science , 25(1), 7-29.
https://doi.org/10.1177/0956797613504966
Cuyvers, K., Van den Bossche, P., & Donche, V. (2020).
Self-regulation of professional learning in the workplace: a state
of the art and future perspectives. Vocations and Learning,
13(2), 281-312. https://doi.org/10.1007/s12186-019-09236-x
Dabbagh, N., & Kitsantas, A. (2004). Supporting
self-regulation in student-centered web-based learning
environments. In International Journal on E-learning
(Vol. 3, No. 1, pp. 40-47). Association for the Advancement of
Computing in Education (AACE).
Endedijk, M. D., & Cuyvers, K. (2022). Self-regulation of
professional learning: towards a new era of research. In
Research approaches on workplace learning: insights from a
growing field (pp. 219-237). Springer International
Publishing. https://doi.org/10.1007/978-3-030-89582-2_10
Frankola, K. (2001). Why online learners drop out. American
Society for Training and Development . Retrieved August
25, 2023, from
http://www.c3l.uni-oldenburg.de/cde/support/readings/frankola.htm
Galesic, M., & Bosnjak, M. (2009). Effects of questionnaire
length on participation and indicators of response quality in a
web survey. Public Opinion Quarterly , 73(2),
349-360. https://doi.org/10.1093/poq/nfp031
Giannakos, M. N., Lee-Cultura, S., & Sharma, K. (2021).
Sensing-based analytics in education: The rise of multimodal data
enabled learning systems. IT Professional, 23(6),
31-38. https://doi.org/10.1109/MITP.2021.3089659
Greene, J. A., & Azevedo, R. (2010). The measurement of
learners’ self-regulated cognitive and metacognitive processes
while using computer-based learning environments. Educational
Psychologist, 45(4), 203-209. https://doi.org/10.1080/00461520.2010.515935
Hadwin, A. F., Järvelä, S., & Miller, M. (2011).
Self-regulated, co-regulated, and socially shared regulation of
learning. Handbook of self-regulation of learning and
performance , 30, 65-84.
Halawi, L., Clarke, A., & George, K. (2022). Decision Trees
and Ensemble. In Harnessing the Power of Analytics (pp.
61-81). Springer International Publishing. https://doi.org/10.1007/978-3-030-89712-3_5
Hew, K. F., & Cheung, W. S. (2014). Students’ and instructors’
use of massive open online courses (MOOCs): Motivations and
challenges. Educational Research Review , 12,
45-58. https://doi.org/10.1016/j.edurev.2014.05.001
Hilpert, J. C., Greene, J. A., & Bernacki, M. (2023).
Leveraging complexity frameworks to refine theories of engagement:
Advancing self‐regulated learning in the age of artificial
intelligence. British Journal of Educational Technology
, 54(5), 1204-1221.
https://doi.org/10.1111/bjet.13340
Hosmer Jr, D. W., Lemeshow, S., & Sturdivant, R. X. (2013).
Applied logistic regression . John Wiley & Sons.
https://doi.org/10.1002/9781118548387
IMARC Group. (2023). E-learning market: Global industry
trends, share, size, growth, opportunity and forecast 2023-2028
. Retrieved from https://www.imarcgroup.com/e-learning-market
Jain, A. K., Murty, M. N., & Flynn, P. J. (1999). Data
clustering: A review. ACM Computing Surveys, 31(3),
264-323.
https://doi.org/10.1145/331499.331504
Jansen, R. S., van Leeuwen, A., Janssen, J., Conijn, R., &
Kester, L. (2020). Supporting learners’ self-regulated learning in
Massive Open Online Courses. Computers & Education,
146, 103771. https://doi.org/10.1016/j.compedu.2019.103771
Jansen, R., van Leeuwen, A., Janssen, J., & Kester, L. (2020).
A mixed method approach to studying self-regulated learning in
MOOCs: combining trace data with interviews. Frontline
Learning Research, 8 (2), 35-64.
https://doi.org/10.14786/flr.v8i2.539
Järvelä, S., & Hadwin, A. F. (2013). New frontiers: Regulating
learning in CSCL. Educational Psychologist, 48(1),
25-39. https://doi.org/10.1080/00461520.2012.748006
Jordan, K. (2015). Massive open online course completion rates
revisited: Assessment, length and attrition. International
Review of Research in Open and Distributed Learning ,
16(3), 341-358. https://doi.org/10.19173/irrodl.v16i3.2112
Kizilcec, R. F., & Halawa, S. (2015). Attrition and
achievement gaps in online learning. In Proceedings of the Second
(2015) ACM Conference on Learning @ Scale (pp.
57-66). Association for Computing Machinery.
https://doi.org/10.1145/2724660.2724680
Kizilcec, R. F., Pérez-Sanagustín, M., & Maldonado, J. J.
(2017). Self-regulated learning strategies predict learner
behavior and goal attainment in massive open online courses.
Computers & Education, 104 , 18-33. https://doi.org/10.1016/j.compedu.2016.10.001
Lee, D., Watson, S. L., & Watson, W. R. (2019). Systematic
literature review on self-regulated learning in massive open
online courses. Australasian Journal of Educational
Technology , 35(1).
https://doi.org/10.14742/ajet.3749
Li, Q., Baker, R., & Warschauer, M. (2020). Using clickstream
data to measure, understand, and support self-regulated learning
in online courses. The Internet and Higher Education, 45,
100727. https://doi.org/10.1016/j.iheduc.2020.100727
Littlejohn, A., & Margaryan, A. (2014). Technology-enhanced
professional learning. International handbook of research in
professional and practice-based learning , 1187-1212. https://doi.org/10.1007/978-94-017-8902-8_43
Littlejohn, A., & Milligan, C. (2015). Designing MOOCs for
professional learners: Tools and patterns to encourage
self-regulated learning. eLearning Papers, 42 ,
38-47.
https://doi.org/10.6084/M9.FIGSHARE.866773
Littlejohn, A., Hood, N., Milligan, C., & Mustain, P. (2016).
Learning in MOOCs: Motivations and self-regulated learning in
MOOCs. The Internet and Higher Education , 29,
40-48. https://doi.org/10.1016/j.iheduc.2015.12.003
Maldonado-Mahauad, J. J., Pérez-Sanagustín, M., Kizilcec, R. F.,
Morales, N., & Munoz-Gama, J. (2018). Mining theory-based
patterns from Big Data: Identifying self-regulated learning
strategies in Massive Open Online Courses. Computers in Human
Behavior, 90, 179-196.
https://doi.org/10.1016/j.chb.2017.11.011
Malmberg, J., Järvenoja, H., & Järvelä, S. (2013). Patterns in
elementary school students′ strategic actions in varying learning
situations. Instructional Science, 41(5),
933-954. https://doi.org/10.1007/s11251-012-9262-1
Margaryan, A., Littlejohn, A., & Milligan, C. (2013).
Self‐regulated learning in the workplace: strategies and factors
in the attainment of learning goals. International Journal of
Training and Development, 17(4), 245-259.
https://doi.org/10.1111/ijtd.12013
Men, Q., Gimbert, B., & Cristol, D. (2023). The effect of
self-regulated learning in online professional training.
International Journal of Mobile and Blended Learning (IJMBL)
, 15(2), 1-17.
https://doi.org/10.4018/IJMBL.318225
Milligan, C., & Littlejohn, A. (2014). Supporting professional
learning in a massive open online course. International
Review of Research in Open and Distributed Learning , 15(5),
197-213. https://doi.org/10.19173/irrodl.v15i5.1855
Moreno-Marcos, P. M., Muñoz-Merino, P. J., Maldonado-Mahauad, J.,
Pérez-Sanagustín, M., Alario-Hoyos, C., & Kloos, C. D. (2020).
Temporal analysis for dropout prediction using self-regulated
learning strategies in self-paced MOOCs. Computers &
Education, 145, 103728. https://doi.org/10.1016/j.compedu.2019.103728
Muljana, P. S., & Luo, T. (2023). Pursuing Professional
Learning by Using Social Media: How Do Instructional Designers
Apply Self-Regulated Learning?. Research in Learning
Technology, 31.
https://doi.org/10.25304/rlt.v31.2934
Panadero, E., Kirschner, P. A., Järvelä, S., Malmberg, J., &
Järvenoja, H. (2015). How individual self-regulation affects group
regulation and performance: A shared regulation intervention. Small
Group Research , 46(4), 431-454.
https://doi.org/10.1177/1046496415591219
Panadero, E., Klug, J., & Järvelä, S. (2016). Third wave of
measurement in the self-regulated learning field: when measurement
and intervention come hand in hand. Scandinavian Journal of
Educational Research, 60(6), 723-735. https://doi.org/10.1080/00313831.2015.1066436
Pintrich, P. R. (1991). A manual for the use of the Motivated
Strategies for Learning Questionnaire (MSLQ).
https://doi.org/10.1037/t09161-000
Pintrich, P. R. (1999). The role of motivation in promoting and
sustaining self-regulated learning. International Journal of
Educational Research, 31 (6), 459-470. https://doi.org/10.1016/S0883-0355(99)00015-4
R Core Team. (2023). R: A language and environment for
statistical computing . R Foundation for Statistical
Computing.
RStudio Team. (2023). RStudio: Integrated Development for R.
Posit.
Reparaz, C., Aznárez-Sanado, M., & Mendoza, G. (2020).
Self-regulation of learning and MOOC retention. Computers in
Human Behavior, 111 , 106423.
https://doi.org/10.1016/j.chb.2020.106423
Robin, X., Turck, N., Hainard, A., Tiberti, N., Lisacek, F.,
Sanchez, J. C., & Müller, M. (2011). pROC: an open-source
package for R and S+ to analyze and compare ROC curves. BMC
Bioinformatics, 12, 1-8.
https://doi.org/10.1186/1471-2105-12-77
Roll, I., & Winne, P. H. (2015). Understanding, evaluating,
and supporting self-regulated learning using learning analytics.
Journal of Learning Analytics , 2(1), 7-12.
https://doi.org/10.18608/jla.2015.21.2
Richardson, M., Abraham, C., & Bond, R. (2012). Psychological
correlates of university students' academic performance: a
systematic review and meta-analysis. Psychological Bulletin,
138(2), 353. https://doi.org/10.1037/a0026838
Schunk, D. H. (2005). Self-regulated learning: The educational
legacy of Paul R. Pintrich. Educational Psychologist, 40(2),
85-94. https://doi.org/10.1207/s15326985ep4002_3
Sharma, K., Papamitsiou, Z., & Giannakos, M. (2019). Building
pipelines for educational data using AI and multimodal analytics:
A “grey‐box” approach. British Journal of Educational
Technology, 50(6), 3004-3031.
https://doi.org/10.1111/bjet.12854
Training Magazine. (2023). 2023 Training Industry Report.
Training Magazine. Retrieved from
https://trainingmag.com/trgmag-article/2023-training-industry-report
Tempelaar, D., Rienties, B., & Nguyen, Q. (2020). Subjective
data, objective data and the role of bias in predictive modelling:
Lessons from a dispositional learning analytics application. PLOS
ONE, 15 (6), e0233977. https://doi.org/10.1371/journal.pone.0233977
Viberg, O., Khalil, M., & Baars, M. (2020, March).
Self-regulated learning and learning analytics in online learning
environments: A review of empirical research. In Proceedings
of the tenth international conference on learning analytics
& knowledge (pp. 524-533).
https://doi.org/10.1145/3375462.3375483
Valdiviezo, A. D., & Crawford, M. (2020). Fostering
soft-skills development through learning experience platforms
(LXPs). Handbook of Teaching with Technology in Management,
Leadership, and Business , 312-321. https://doi.org/10.4337/9781789901658.00040
Van Halem, N., van Klaveren, C., Drachsler, H., Schmitz, M., &
Cornelisz, I. (2020). Tracking Patterns in Self-Regulated Learning
Using Students’ Self-Reports and Online Trace Data.
Frontline Learning Research, 8(3), 140-163.
https://doi.org/10.14786/flr.v8i3.497
Wan, Z., Compeau, D., & Haggerty, N. (2012). The effects of
self-regulated learning processes on e-learning outcomes in
organizational settings. Journal of Management Information
Systems, 29(1), 307-340. https://doi.org/10.2753/MIS0742-1222290109
Wickham, H. (2016). Data analysis. In ggplot2: elegant
graphics for data analysis (pp. 189-201). Springer
International Publishing. https://doi.org/10.1007/978-3-319-24277-4_9
Winne, P. H., & Hadwin, A. F. (1998). Studying as
self-regulated learning. Metacognition in educational theory
and practice, 277-304.
Winne, P. H. (2010). Improving measurements of self-regulated
learning. Educational Psychologist, 45(4),
267-276. https://doi.org/10.1080/00461520.2010.517150
Winne, P. H. (2011). A cognitive and metacognitive analysis of
self-regulated learning: Faculty of education, Simon Fraser
University, Burnaby, Canada. In Handbook of self-regulation
of learning and performance (pp. 29-46). Routledge.
Winne, P. H. (2017). Learning analytics for self-regulated
learning. Handbook of learning analytics , 241-249.
https://doi.org/10.18608/hla17.021
Winne, P. H. (2020). Construct and consequential validity for
learning analytics based on trace data. Computers in Human
Behavior, 112 , 106457.
https://doi.org/10.1016/j.chb.2020.106457
Winne, P. H., & Hadwin, A. F. (2013). nStudy: Tracing and
supporting self-regulated learning in the Internet. In
International handbook of metacognition and learning
technologies (pp. 293-308). Springer. https://doi.org/10.1007/978-1-4419-5546-3_20
Wong, J., Baars, M., de Koning, B. B., & Paas, F. (2021).
Examining the use of prompts to facilitate self-regulated learning
in Massive Open Online Courses. Computers in Human Behavior,
115, 106596.
https://doi.org/10.1016/j.chb.2020.106596
Yeomans, M., & Reich, J. (2017, March). Planning prompts
increase and forecast course completion in massive open online
courses. In Proceedings of the seventh international
learning analytics & knowledge conference (pp.
464-473). https://doi.org/10.1145/3027385.3027416
Ye, D., & Pennisi, S. (2022). Using trace data to enhance
students' self-regulation: A learning analytics perspective.
The Internet and Higher Education , 54, 100855.
https://doi.org/10.1016/j.iheduc.2022.100855
Zimmerman, B. J., & Pons, M. M. (1986). Development of a
structured interview for assessing student use of self-regulated
learning strategies. American Educational Research Journal,
23(4), 614-628.
https://doi.org/10.3102/00028312023004614
Zimmerman, B. J. (2000). Attaining self-regulation: A social
cognitive perspective. In Handbook of self-regulation
(pp. 13-39). Academic Press.
https://doi.org/10.1016/B978-012109890-2/50031-7
Zimmerman, B. J., & Moylan, A. R. (2009). Where metacognition
and motivation intersect. In D. J. Hacker, J. Dunlosky, & A.
C. Graesser (Eds.), Handbook of metacognition in education
(pp. 299-316). Routledge.
Please indicate the extent to which the following statements describe your behaviour in the MOOC. Indicate how you typically behave rather than how you think you should behave. There are no correct or incorrect responses to these questions.
Goal Setting
1. I set personal standards for performance in my learning.
o Very true for me
o True for me
o Quite true for me
o Sometimes true for me
o Not at all true for me
2. I set short-term (daily or weekly) goals as well as long-term goals in my learning.
o Very true for me
o True for me
o Quite true for me
o Sometimes true for me
o Not at all true for me
3. I set realistic deadlines for learning.
o Very true for me
o True for me
o Quite true for me
o Sometimes true for me
o Not at all true for me
Removed Item:
o I set goals to help me manage studying time for my learning.
Strategic Planning
4. I ask myself questions about what I am to study before I begin to learn.
o Very true for me
o True for me
o Quite true for me
o Sometimes true for me
o Not at all true for me
5. I think of alternative ways to solve a problem and choose the best one.
o Very true for me
o True for me
o Quite true for me
o Sometimes true for me
o Not at all true for me
6. I organise my study time to accomplish my goals to the best of my ability.
o Very true for me
o True for me
o Quite true for me
o Sometimes true for me
o Not at all true for me
Removed Item:
o When planning my learning, I use and adapt strategies that have worked in the past
<Task Strategies
7. I try to translate new information into my own words.
o Very true for me
o True for me
o Quite true for me
o Sometimes true for me
o Not at all true for me
8. I change strategies when I do not make progress while learning.
o Very true for me
o True for me
o Quite true for me
o Sometimes true for me
o Not at all true for me
9. When I study for courses, I make notes to help me organise my thoughts.
o Very true for me
o True for me
o Quite true for me
o Sometimes true for me
o Not at all true for me
10. I create my own examples to make information more meaningful.
o Very true for me
o True for me
o Quite true for me
o Sometimes true for me
o Not at all true for me
11. I look for additional resources beyond the core course materials to improve my understanding.
o Very true for me
o True for me
o Quite true for me
o Sometimes true for me
o Not at all true for me
Removed Item:
o I ask myself how what I am learning is related to what I already know
Elaboration
12. When I am learning, I try to relate new information I find to what I already know.
o Very true for me
o True for me
o Quite true for me
o Sometimes true for me
o Not at all true for me
13. I try to apply my previous experience when learning.
o Very true for me
o True for me
o Quite true for me
o Sometimes true for me
o Not at all true for me
Removed Item:
o When I am learning, I combine different sources of information (for example: people, web sites, printed material).
Self-Evaluation
14. I know how well I have learned once I have finished a task.
o Very true for me
o True for me
o Quite true for me
o Sometimes true for me
o Not at all true for me
15. I think about what I have learned after I finish.
o Very true for me
o True for me
o Quite true for me
o Sometimes true for me
o Not at all true for me
Removed Item:
o I ask myself if there were other ways to do things after I finish learning.
Help Seeking
16. When I do not understand something, I ask others for help.
o Very true for me
o True for me
o Quite true for me
o Sometimes true for me
o Not at all true for me
17. I try to identify others whom I can ask for help if necessary
o Very true for me
o True for me
o Quite true for me
o Sometimes true for me
o Not at all true for me
18. I ask others for more information when I need it.
o Very true for me
o True for me
o Quite true for me
o Sometimes true for me
o Not at all true for me
Removed Item:
o Even if I am having trouble learning, I prefer to do the work on my own. (reverse coded item)
Reference:
Kizilcec, R. F., Pérez-Sanagustín, M., & Maldonado, J. J. (2017). Self-regulated learning strategies predict learner behavior and goal attainment in Massive Open Online Courses. Computers & Education, 104, 18-33.